StackAccel

≡ Menu

python

Getpivots

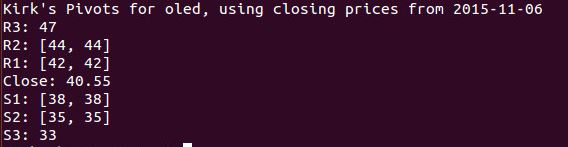
Getpivots (pivot-point-calculator) can be used for identifying areas of support and resistance in the next day’s trading session. Getpivots calculates pivot points for a ticker symbol using the most recent closing price data, and leverages several different algorithms which include the Floor/Classic formula, Woodie’s Formula, as well as Kirk’s formula.

getpivots-screencap1

Getpivots complements Getstockinfo in a way that I could easily incorporate into my routine.  While I’ve used spreadsheets for calculating the pivots in the past, it never really fit my workflow and always seemed to be some combination of too clunky, or too manual.   With getpivots, I can quickly check each position of interest, and get pivots and context for tomorrow’s trading session.

Expanding on pivot points for those interested, pivot points indicate price levels of significance in technical analysis, and can suggest key areas of support and resistance, as well as trade-to targets when levels are broken.  You can use them for determining the trend of a position… pivot points broken moving up, are bullish indicators.  Pivot points broken when moving down, are bearish.  Pivot points may be used in a situation where you want to put a limit order in to purchase shares in XYZ Corp., if the price breaks a pivot resistance level.  Alternatively, you might consider setting a stop-loss order if a support level is broken.

How I use it:

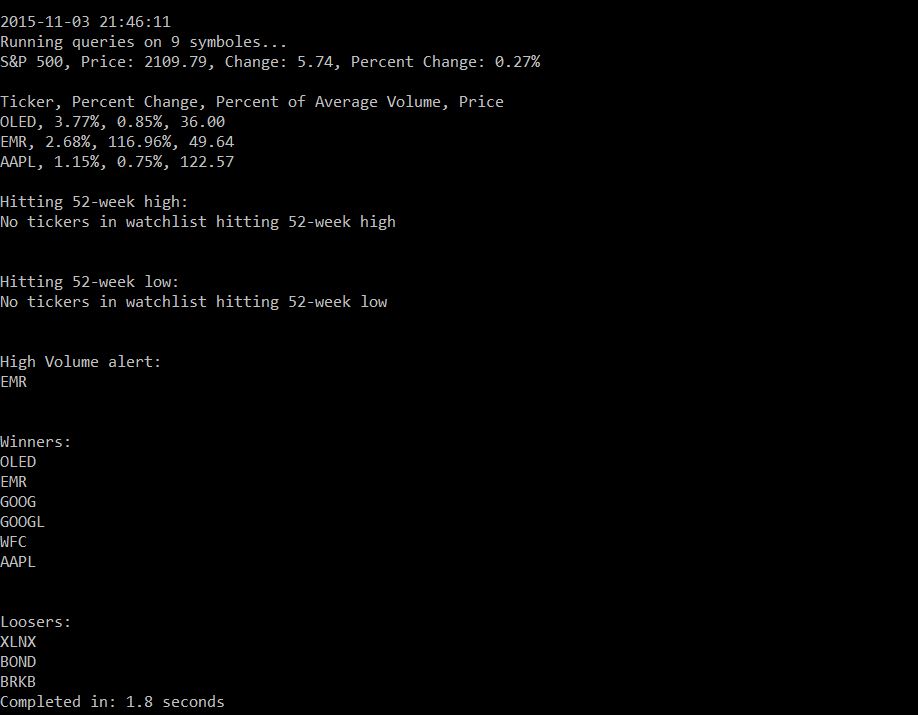
I use getstockinfo to get a quick summary of all of my positions and any watchlists that I’m actively tracking, and then use the summary output as an input for my homework.  One aspect of the homework is using getpivots to run though tickers of interest in getstockinfo.  In some cases, next-steps would include reviewing charts, and then possibly setting triggers to buy or sell during the next day’s trading session.  For buy and hold investors, you might use something like getpivots to help plan an entry, or exit a long-term position.  Bottom line… getpivots is a tool which can be incorporated into your routine to help provide additional insight and help with your decision making process.

Installation: pip install getpivots

Usage: Getpivots.py –t tickersymbol –f/w/k -c

Example: python getpivots.py –t tickersymbol –f

Dependencies: Python 2.7, ystockquote, yahoo_finance, regex, argparse, datetime

Getstockinfo

GSI (getstockinfo) is a python script that performs basic analysis on a specified watch list of US equities, and can be used to better understand the performance of your positions within the context of daily market fluctuations, as well as accelerate your research.

This tool exists because I wanted a quick and easy way to automate some basic analysis steps on all of my positions, and I wanted to do so without necessarily having to individually evaluate each and every position or login to all of my accounts.  It’s one thing to look at your portfolio summary on Mint, or Yahoo Finance, and have some vague or general awareness of how your investments performed.  Seeing that your portfolio went up in value is nice, I suppose… but it’s not really actionable or particularly useful information by itself.  In fact, without context, it might even be more of a distraction… maybe a reminder of the homework that you know you should be doing.  Anyway, so what do I mean by context?  Well, if you’re looking at each of your investments every day… comparing them against some sort of benchmark, evaluating the volume, reviewing the charts in multiple time frames, etc. you start to develop an understanding of the context surround your positions, and the market.  Maybe you notice that your tech stocks keep hitting new 52-week highs when the market is just bouncing around, or maybe you notice that one of your industrials keeps showing up on the daily looser list, even though the market is going up.  Understanding the context in a meaningful manner and identifying actionable next-steps can help you create value.  So, basically I wanted something that could automate some of the daily work and filter down the list of things to pay attention to, and at the same time be something I could understand at a glance every day.

Doesn’t that sound like a pretty common problem that you’d think would have been solved by now?

It did to me too.  Over the years, I’ve used an assortment of tools to try to improve my homework.  Everything from various finance web sites, to smartphone apps, to brokerage alerts, to Excel spreadsheets that used VBA to pull in pricing, and eventually to charting software and trading platforms.  Using a combination of tools, at some trade-off between cost, complexity, and effort… my goals were mostly achievable.  Except for the quick and easy part.  So that’s why getstockinfo exists.  I think it’s is pretty easy to use… create watchlist, point the script at it, and let it go to work.  It does some basic analysis for you, and gets you pointed in the right direction for your homework.  Most important to me, is that it helps me understand a bit more about the context about my positions at a glance.

Next-Steps:

If you have some Python experience, just do a “pip install getstockinfo” from a command prompt, and you’ll be off and running.   Otherwise, you’ll need to get Python 2.7 installed, then download a copy of the script, and create or borrow a watchlist .  Then run the script against it.

Usage:

python getstockinfo-release.py –v –nl –wl –ll –ip –op –nh –f portfolio.txt

Which will produce output that looks something like the below…

getstockinfo output

How I use it:

I run getstockinfo as a cronjob from bash script with all of the arguments turned on… it runs through my watchlists, generates some output, and that then gets emailed to me after the close every day.  I turn around and use that output for further investigation.  Stocks that I own with unusual volume, or that repeatedly show up on the daily winner/looser list, that are outperforming the S&P 500, etc… are all things which merit further investigation.

Other:

Thing to keep in mind… make sure your ticker symbols are valid on Yahoo Finance.  On the last line of your watchlist, make sure you don’t add a carriage return.  Go ahead and give it a try, and let me know if you have any questions.

Visit Us On Twitter